
多拠点ビジネス特化型ダッシュボード
ABILI Board
組織に散在するデータを一画面に集約し
分析から実行までデータドリブンな経営を実現
多拠点ビジネス特化型ダッシュボード
組織に散在するデータを一画面に集約し
分析から実行までデータドリブンな経営を実現
ABOUT
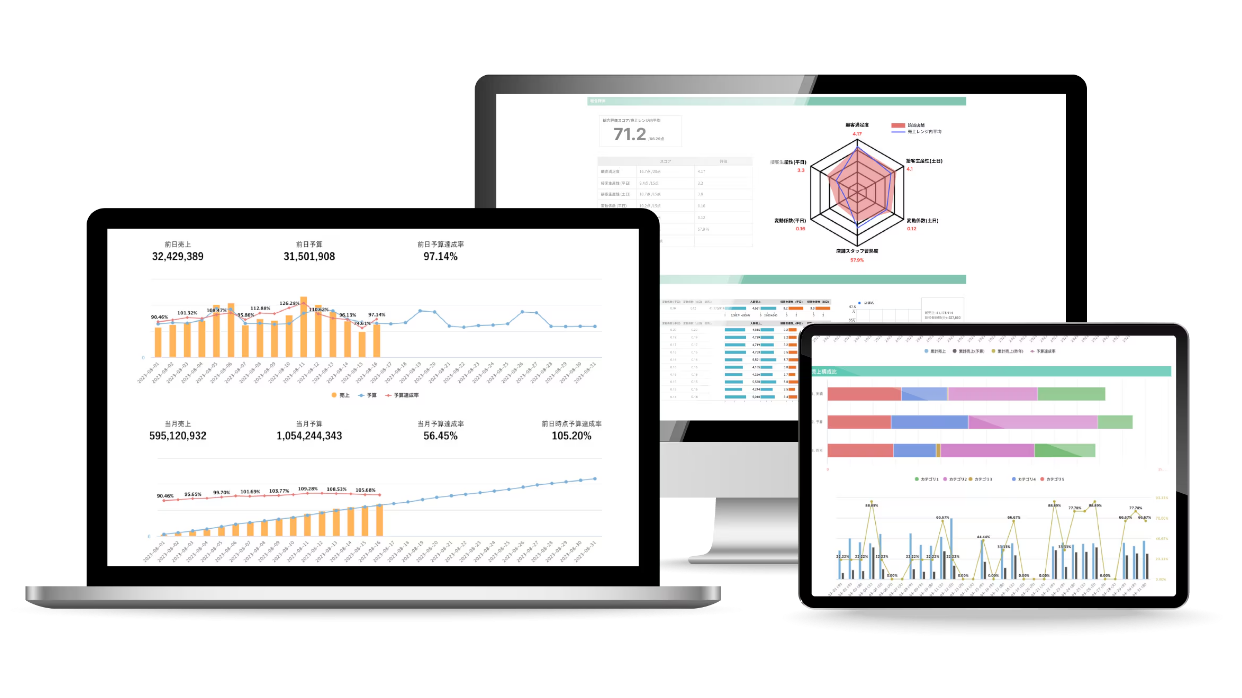
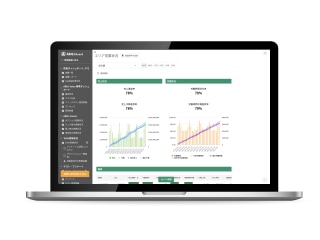
ABILI Boardは、組織内に点在するあらゆるデータを集約したダッシュボードを、スピーディーかつ低コストで構築できるプラットフォームです。
売上や顧客満足度など、多拠点ビジネスの経営判断に必要となる様々な情報のタイムリーな分析を実現。
事業の成長を阻害するボトルネックや、品質のバラつき、拠点に潜む本来の力などを可視化することで、本部と現場のデータに基づいた確かな意思決定と改善の実行を支援します。
PROBLEM
PROBLEM 01
売上や人件費などのデータが分散し、課題を特定できていない
PROBLEM 02
ノウハウ不足でBIツールを使いこなせていない
PROBLEM 03
可視化したデータが具体的な改善行動に結びついていない
SOLUTION
データの収集から蓄積・分析・可視化までの課題を解決するABILI Boardが、
あらゆる企業様の多拠点ビジネスの意思決定に活躍しています。
01
ABILI Boardは、貴社専用のダッシュボードをオーダーメイドで構築し、売上・人件費・顧客アンケート・勤怠・POSデータなど、多拠点ビジネスにおいて部門ごとに散在する様々な情報を一元化。
リアルタイムでの課題の発見とデータの相関分析により、店舗・拠点単位のボトルネックや成果要因の特定、人的資本経営に向けたROIの可視化や最適化が可能となります。
確かな数字を組織の共通言語とすることで、勘や経験による属人的なマネジメントから脱却し、データドリブンな経営判断を支援します。


02
経営・本部・現場など、組織内の様々な視点に合わせたシンプルなUI設計を採用しているため、専門知識は不要で誰でも直感的に操作できます。
ツールの導入支援はもちろん、データの収集・加工・統合などの経営管理業務の代行や、定着に向けたレクチャー・運用支援も、初期費用と月額の利用料に含まれています。
現場の担当者でも経営状況をリアルタイムに確認でき、「店舗の経営者」としての視点と意識の醸成につながります。
03
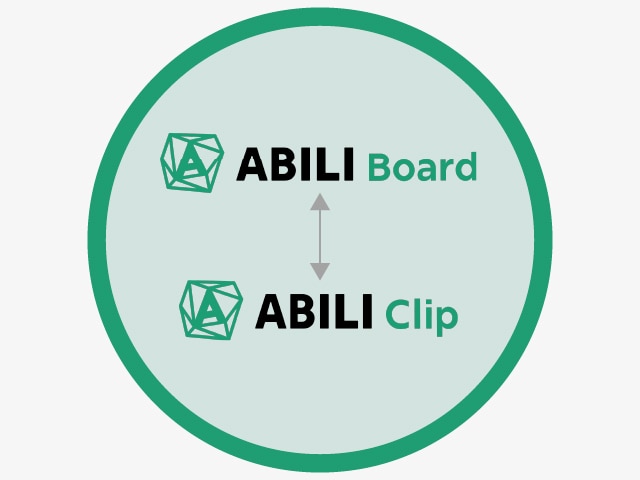
さらに、ABILIシリーズのプロダクト群と連携することで、データの分析にとどまらず、更なる効果的な実行が可能に。
例えば、ABILI Voiceで取得した顧客フィードバックを店舗の売上数値と連動させ、課題を可視化。さらに、課題に対応する教育動画をABILI Clipで現場へ展開することで、改善実行までの仕組みをABILI Boardによって構築できます。
情報の分析だけでなく、即座に改善へと移せる効率的な経営サイクルをワンストップで完結します。

FEATURES
多拠点ビジネスの課題を解決するための実用的な機能が揃っています。
事業のデータを横断的かつリアルタイムに把握でき、改善を実行するための様々なデータソースと連携できます。
研修の実施によって店舗の生産性やリピート率がどう変化したかなど、貴社の重視する経営指標と掛け合わせた分析が可能です。
課題を可視化して終わりではなく、改善に向けた教育コンテンツをABILI Clipで配信するなど、ABILIシリーズとの連携で活用の幅が広がります。
こんな方におすすめ
DEMO
ABILI Boardの導入後のイメージが具体的に描けるオンラインデモをご用意しています。
PRICE
貴社独自のダッシュボード環境を最小限の工数で、安価に構築することができます。
月額料金
30万円(税抜)〜
※扱うデータ量と利用ユーザー数に応じて変動します。
※別途初期費用がかかります。
CONTACT
FLOW

貴社が現在活用されているデータ、データ活用における課題、可視化したい指標などをお聞かせください。

連携するデータソースの特定、必要なKPIの設定、ダッシュボードのデザイン、構成などを定義します。 データ戦略の策定などのご支援が必要な場合は弊社コンサルティング事業(Chain Consulting)にて対応可能です。
貴社のデータソースとの連携設定を進め、定義した要件に基づき、貴社専用のダッシュボードを構築します。

導入初期の操作説明やデータ活用に関するトレーニングはもちろん、分析結果から具体的な改善アクションにつなげるための活用支援もご用意しています。
Q&A
Q. | ABILI Boardとはどのようなサービスですか。 |
|---|---|
A. | ABILI Boardは多店舗でビジネスを展開されている企業様向けのサービスです。店舗の売上、スタッフの勤怠、お客様のアンケートなど、社内に散らばっているデータを一つの画面にまとめて、グラフなどでわかりやすく表示するツールです。店舗や会社全体の状況をひと目で把握し、問題点を見つけやすくするのに役立ちます。 |
Q. | どのようなデータを見ることができますか。 |
|---|---|
A. | レジの売上データ(POSデータ)やスタッフの出退勤データ(勤怠データ)、在庫データ、顧客管理データ、お客様アンケートの結果といった店舗運営に関わる様々なデータを連携して表示できます。これまでExcelなどでバラバラに管理していた情報をまとめて見られるようになります。 |
Q. | ABILI Boardを使うと、店長やSVにはどのようなメリットがありますか。 |
|---|---|
A. | 膨大な数値情報を見なくとも、担当している店舗の状況(売上目標の達成度、人件費の状況、お客様からの評価など)がグラフで直感的にわかるようになります。どのような課題があるかを素早く見つけられるので、データに基づいた的確な指示やアドバイスを現場に出しやすくなります。データ集計作業の時間も削減できます。 |
©2014-2025 ClipLine, Inc.